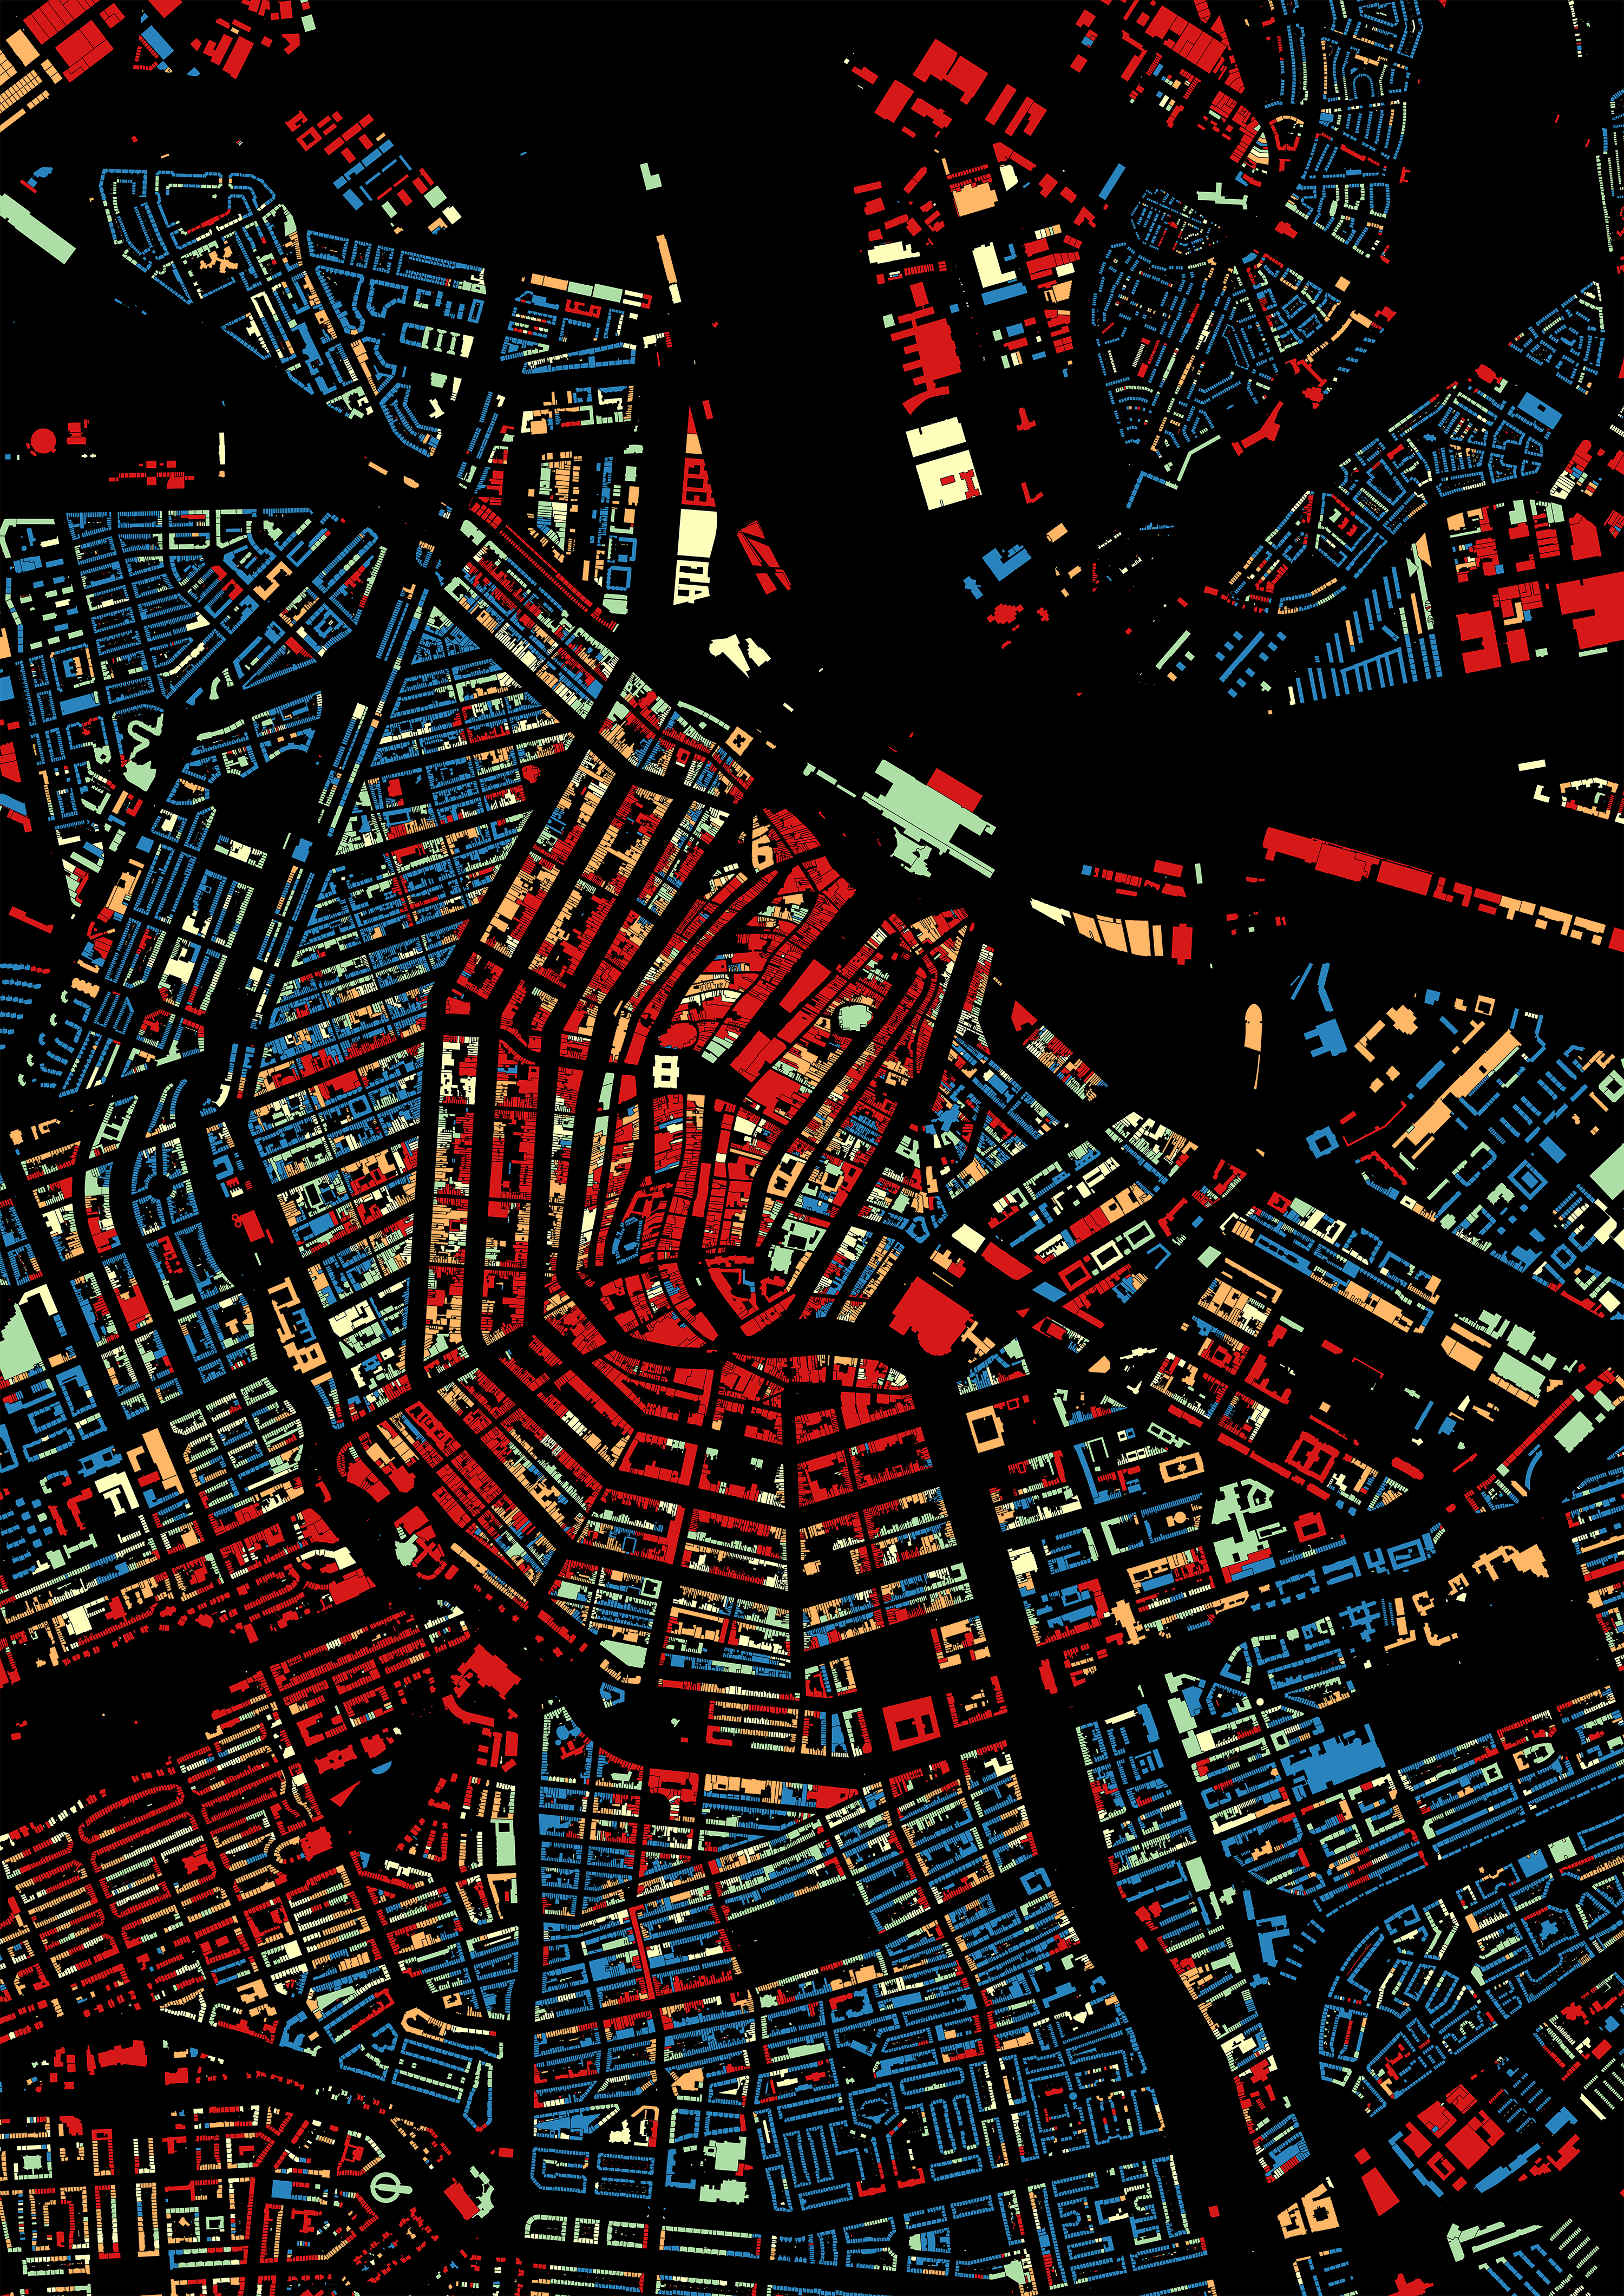
I generated this map of energy usage in Amsterdam as part of a prototyping project. It was created using QGIS and PostgreSQL.
I generated this map of energy usage in Amsterdam as part of a prototyping project. It was created using QGIS and PostgreSQL.